Geotab Studied 22,000 EVs. We Looked at 150 VW ID.4s. Here's What We Found.
Geotab's 2025 battery health study is the largest public analysis of real-world EV degradation: 22,700 vehicles across 21 models. Their headline finding: batteries lose an average of 2.3% capacity per year, and DC fast charging is the single biggest stressor — doubling the degradation rate.
That's useful at fleet scale. But if you're buying a specific used ID.4, an average across 21 anonymized models doesn't tell you much. Is your car's battery healthy? Does the previous owner's fast charging habit matter?
We looked at a community-maintained dataset of 300+ battery scans from over 150 VW ID.4s, collected by owners using OBD tools. The data includes SOH (State of Health), mileage, vehicle age, and DC fast charging history. Here's what it shows.
The Fleet View: Geotab's Numbers
Geotab's key findings across all models:
| Factor | Degradation Rate |
|---|---|
| Overall average | 2.3% per year |
| Low DCFC usage (<12% of sessions) | 1.5% per year |
| High DCFC, high power (>100kW) | 3.0% per year |
| Hot climate penalty | +0.4% per year |
| High utilization penalty | +0.8% per year |
The DCFC finding is striking: vehicles that frequently fast charge at high power (>100kW for more than 40% of DCFC sessions) are projected to reach 76% SOH after 8 years, versus 88% for those that rarely use DCFC. That's a 12-point gap. Geotab identifies this as a separate effect from SOC exposure — heavy DCFC users actually spend less time at extreme charge levels due to the tapering effect above 80%.
But these are averages across 21 anonymized models. Some models handle fast charging better than others, and the study doesn't break down which ones.
The ID.4 View: 150+ Cars, 300+ Scans
The vwidtalk community has been collecting ID.4 battery scans since 2021. Each entry includes the car's Maximum Energy Content (MEC) read via OBD, from which SOH is calculated as a percentage of the nominal "when new" capacity (77 kWh for LG packs, 79.9 kWh for SK). The dataset also tracks total mileage, vehicle age, and estimated DC fast charging percentage. This gives us a model-specific picture that fleet data can't provide.
SOH vs. Mileage
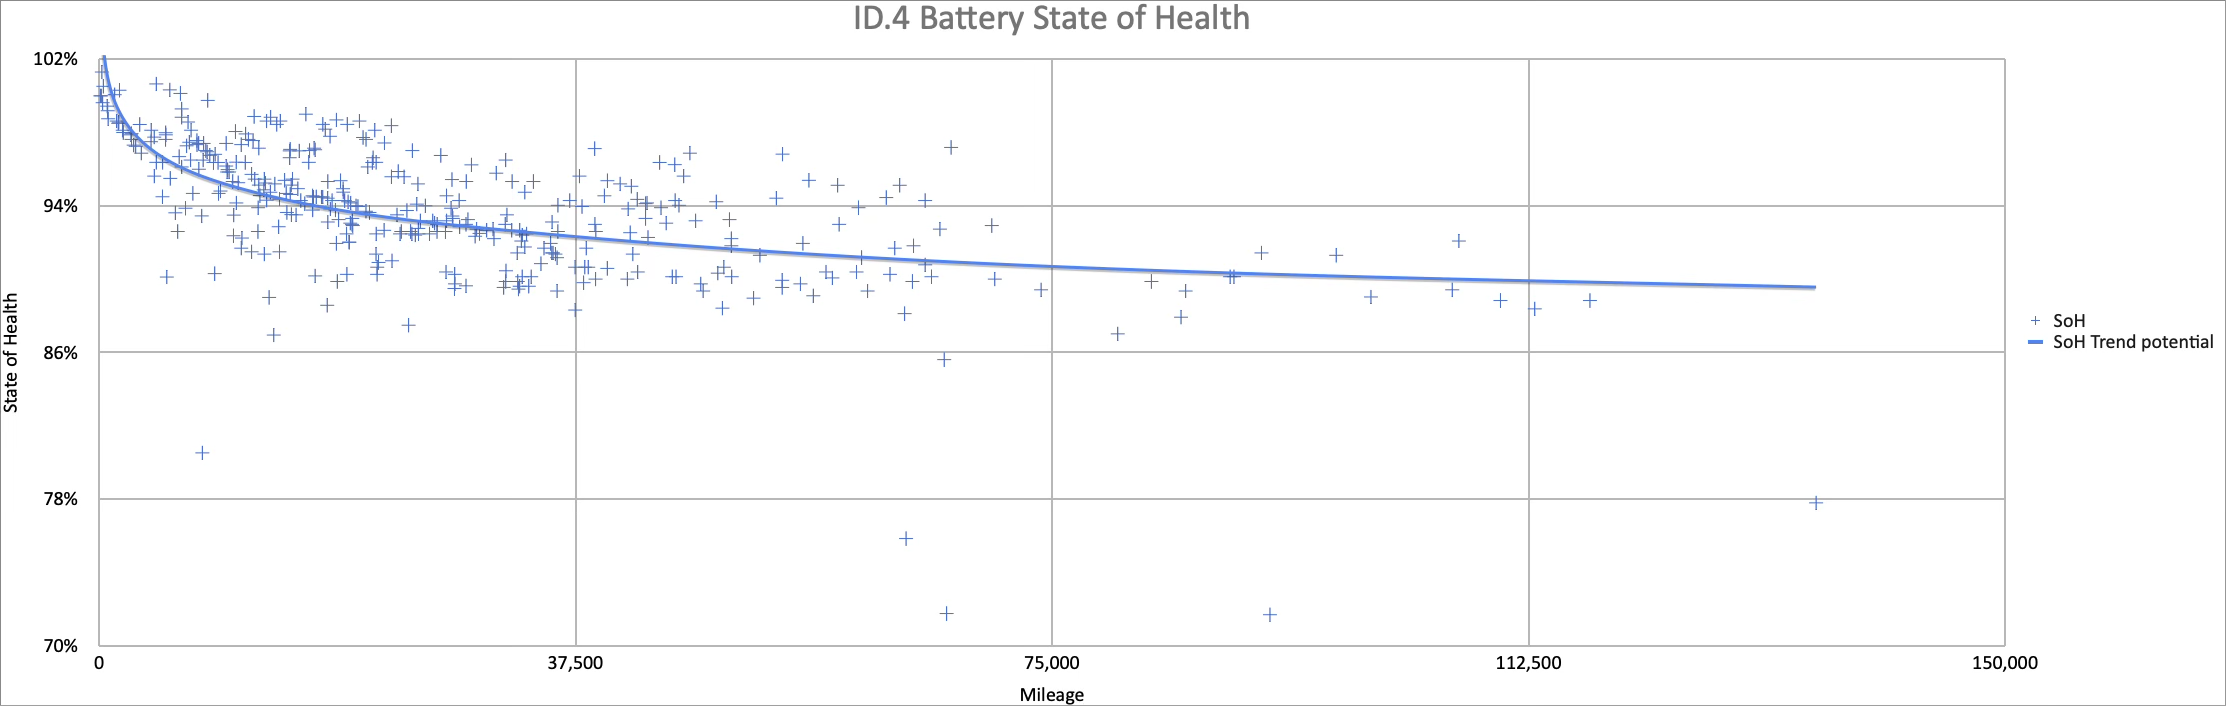
Data: vwidtalk.com community spreadsheet. Each point is one OBD scan.
The curve is logarithmic: a steeper drop in the first 20,000 miles (100% down to ~93%), then a long, gentle slope. At 100,000+ miles, most cars still hold 88–90% SOH. The trend line sits around 89% at 150,000 miles.
A handful of outliers dip below 78%. These look like individual pack issues rather than a mileage-driven pattern — cars with similar or higher mileage sit comfortably in the 90s. We don't have service records for these cars, so we can't say more than that.
SOH vs. Age
A similar logarithmic shape, but tighter. The first 500 days (~1.4 years) accounts for most of the initial drop, from 100% to ~93%. After that, the decline levels off. At 1,500 days (~4 years), the trend is still around 91%.
This is consistent with Geotab's observation that newer EVs show a sharper initial drop before stabilizing. The established models in Geotab's dataset settled to just 1.4% per year after the initial period.
SOH vs. DC Fast Charging
This is where the ID.4 data diverges from the fleet average.
Geotab found that DCFC is the strongest degradation factor across all models. But in the ID.4 dataset, the correlation between DCFC miles and SOH is weak. Cars with 30,000–50,000 estimated DCFC miles show roughly the same 88–91% SOH range as cars with minimal fast charging.
To be clear: we're not claiming DC fast charging has zero impact on the ID.4. The vwidtalk dataset is self-reported, the DCFC percentages are estimates, and we don't have the controlled conditions of Geotab's telematics data. What the data does show is that if there's a DCFC effect on the ID.4, it's much smaller than the 2x penalty Geotab observes across models.
Why might the ID.4 fare differently? We don't know for certain. Possible factors include MEB's active liquid cooling, the BMS charge rate management, or the specific NMC cell chemistry. But we'd be speculating — the data shows the outcome, not the cause.
What Actually Predicts ID.4 Battery Health?
From the data, age and mileage are the strongest predictors, and even those are modest. Most ID.4s follow a predictable curve:
| Age / Mileage | Typical SOH |
|---|---|
| New | 98–100% |
| 1–2 years / 15,000 mi | 93–97% |
| 3–4 years / 40,000 mi | 90–94% |
| 5+ years / 60,000+ mi | 88–92% |
Cars that fall significantly below these ranges likely have individual pack issues, not usage-driven degradation.
What This Means for Used EV Buyers
Fleet studies give you the big picture: EV batteries are robust, and most will outlast the car. But when you're spending $20–40K on a specific used ID.4, you need to know about that car's battery, not the average.
The vwidtalk data shows that most ID.4s age gracefully. But the outliers exist — and they're not predictable from mileage or charging habits alone. The only way to know is to scan the car and look at the actual numbers: SOH, cell balance, temperature spread.
That's what CellPulse does. Plug in a BLE OBD adapter, tap scan, and get every cell voltage, every temperature sensor, and the SOH reading — all in a shareable PDF you can hand to your mechanic or use to negotiate the price.
Data Sources & Acknowledgments
Fleet data from Geotab's 2025 EV Battery Health study by Charlotte Argue (22,700 vehicles, 21 models).
ID.4-specific data from the vwidtalk.com SOH tracking spreadsheet, maintained by the community. Thanks to the 100+ owners who contributed their scan results.
All ID.4 data is self-reported by vehicle owners using OBD diagnostic tools. SOH values represent the BMS-reported Maximum Energy Content (MEC) as a percentage of the nominal usable capacity (77 kWh for LG packs, 79.9 kWh for SK packs). DCFC percentages are owner estimates. This analysis is observational, not controlled.